A lab that has sequenced thousands of rare variants can follow up only a few of them. If the budget is 100, how many real splicing disruptions does a predictor put in its first 100, and does that number depend on how the predictor is configured?
In this exploratory study, two widely used splice predictors, SpliceAI and Pangolin, each scored the same 8,297 of 8,324 held-out MFASS variants under one shared gene annotation, once with a setting called masking off and once with it on. Their top-100 lists held 63, 65, 65 and 66 assay-confirmed disruptions (SpliceAI unmasked, SpliceAI masked, Pangolin unmasked, Pangolin masked; the last is 65 or 66 depending on how three tied scores are ordered). A random 100 would hold about four, since 314 of the 8,297 scored variants are positive.
None of the three paired comparisons establishes a difference in the top 100. Over the whole ranked list, measured by average precision (a score for how early the positives appear; about 0.04 for a random order), masking helped both tools a little, and unmasked Pangolin scored higher than unmasked SpliceAI. That last comparison is between two configured tools, and it does not isolate their network designs.
The previous article on this blog compared the two tools under different annotations and on different variant subsets, so model and annotation effects could not be separated. This run matches the annotation. It also accounts for the 27 variants that could not be scored: 23 appear to trace to a coordinate-conversion step in the source data and four fall outside the chosen transcripts.
What MFASS measures, and what it does not
Splicing cuts the introns out of a gene's RNA copy and joins the exons. A single-letter DNA change can weaken the signals that mark an exon's edges, so the exon is skipped.
MFASS tested 27,733 variants from the ExAC database, most of them extremely rare, inside small three-exon reporter genes (minigenes) built so that skipping the middle exon switches on fluorescence. The assay reports an inclusion index, roughly the share of reporter transcripts that keep the exon. A splice-disrupting variant (SDV) lowers that index by at least 0.5 from a wild-type exon whose index is at least 0.5. In the paper, 1,050 of the 27,733 variants (3.8%) met that bar, and only 17% of them sat at the canonical splice-site positions, so most of the ranking problem is about less obvious variants.
Figure 1. The assay label and the predictors' inputs come from different contexts. MFASS measures exon recognition in a reporter; SpliceAI and Pangolin read genomic sequence and a transcript annotation. Patient RNA and clinical outcome are outside what was measured, and the matched study changes only the prediction side. Sources: earlier rewire.it MFASS article, Figure 1; Chong et al. 2019.
MFASS can record use of an alternative splice site as exon inclusion, so some splice changes are missed. Its reporter context also differs from endogenous exon recognition (Chong et al.).
The benchmark's fixed split holds out 8,324 variants, 315 of them disruptive, in 463 groups. A group is a connected set of exons and genes, kept whole so related variants never straddle training and test. Neither tool is fitted to MFASS labels, so the 19,409 training variants play no part.
Annotation and masking, the two settings outside the network
SpliceAI and Pangolin are deep convolutional networks that read thousands of bases around a position and predict whether it acts as a splice site; Pangolin's architecture resembles SpliceAI's and draws on up to 5,000 bases on each side. Each tool predicts with the reference and the alternate base and reports the largest change in predicted splice-site use within a window, 50 bases either side by default. Each tool combines predictions from several trained networks: an ensemble.
Annotation is the transcript model: a file listing genes and their exon boundaries. Both tools skip a variant that lies outside an annotated gene, or whose recorded reference base does not match the genome (SpliceAI README and utils.py; Pangolin README). A gene can have several transcripts; the Ensembl canonical transcript is one representative per gene. For human protein-coding genes, this is the MANE Select transcript agreed by Ensembl and NCBI wherever one has been set (Ensembl; Morales et al. 2022).
Masking uses the annotation after prediction. With masking on, a predicted gain at an already annotated site and a predicted loss at an unannotated site are set to zero. SpliceAI's current README explains why: those changes are "typically much less pathogenic", and it recommends masked scores for variant interpretation (SpliceAI FAQ). The defaults disagree. SpliceAI 1.3.1 masks nothing unless asked, while Pangolin masks by default.
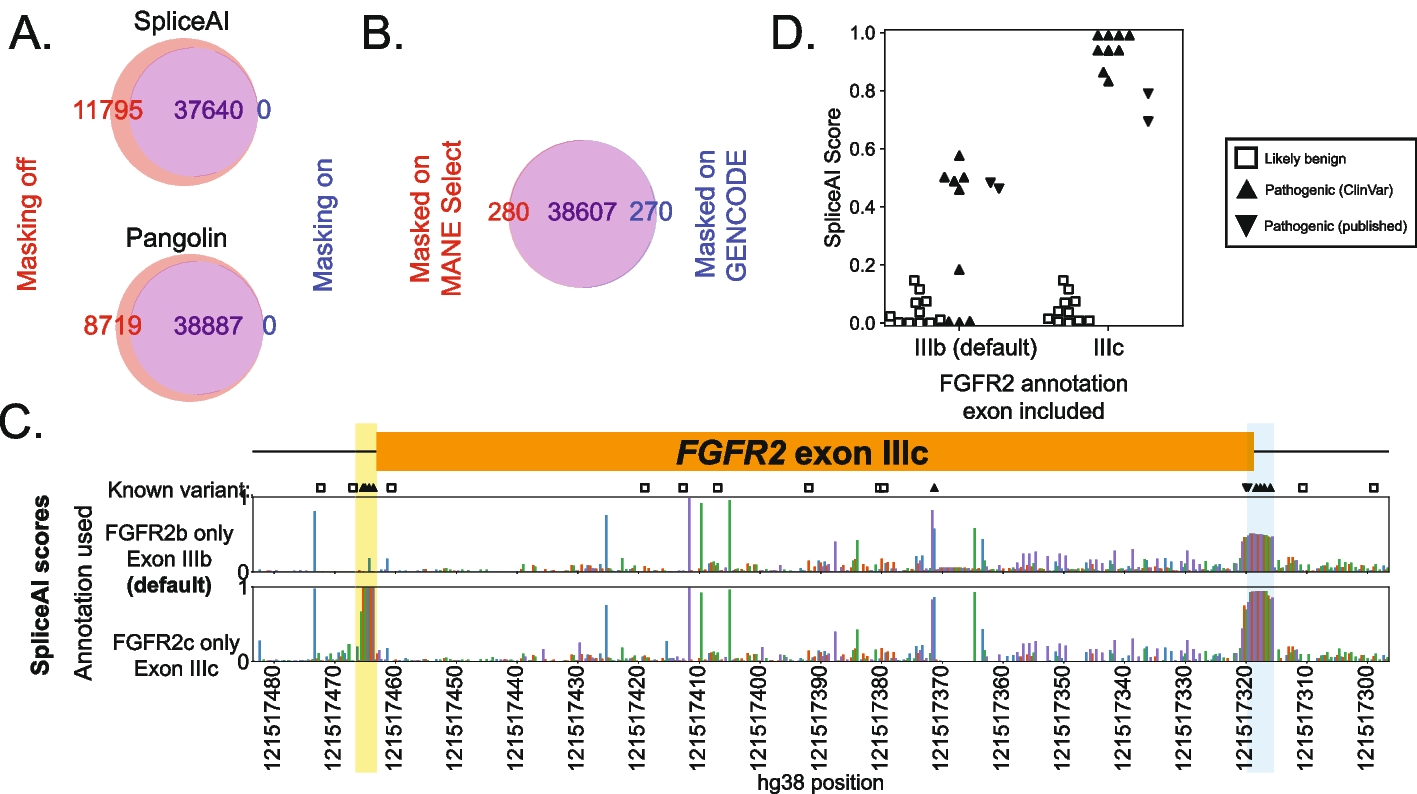
Figure 2. Masking and annotation change which variants a predictor flags. (A) In a genome-wide background set, every masked call was also an unmasked call, and many unmasked calls disappeared with masking on. (B) Pangolin calls under MANE Select versus GENCODE annotation. (C, D) At FGFR2, with masking on, pathogenic variants at an exon missing from the default annotation are scored as neutral until that exon is annotated. Panels A and B count calls at fixed score cutoffs (0.2 in A; 0.1 for Pangolin in B) without assay labels, so they show that the settings change output without ranking the settings by accuracy. This is not MFASS data. Source: Smith & Kitzman, Genome Biology 2023, Fig. 6, CC BY 4.0.
In that background set, switching masking on suppressed nearly one in four variants that SpliceAI had called disruptive at a 0.2 cutoff, and for Pangolin (score at least 0.1), swapping GENCODE for MANE Select annotation flipped about 0.7% of calls in each direction (Smith & Kitzman), who note that masking "requires the provided annotation to be complete". Here the question is how masking changes a ranking on labelled variants.
Four conditions on one annotation
The run plan was written down and frozen before any condition was scored (registration). It fixed four conditions:
| Condition | Tool | Mask | Ensemble | Per-variant score |
|---|---|---|---|---|
| S0 | SpliceAI 1.3.1 | off | 5 models | largest of four delta scores |
| S1 | SpliceAI 1.3.1 | on | 5 models | same |
| P0 | Pangolin 5cf94b8 with per-gene mask patch |
off | 12 models | largest absolute change in splice-site usage |
| P1 | same | on | 12 models | same |
Table 1. The four configurations. SpliceAI's four delta scores are acceptor gain, acceptor loss, donor gain and donor loss. Sources: study README; SpliceAI README.
Held identical across all four (study README):
- the same 8,324 held-out variants, labels and groups;
- one Ensembl canonical transcript for each of the 62,754 genes in the GENCODE v44 annotation, with both tools' annotation files built from that single selection and each gene's span set to its transcript's span;
- the GENCODE 44 GRCh38 reference genome, checked against its published checksum, and a 50-base distance;
- code and model weights checked against pinned hashes before scoring, with fixed thread counts.
Within each tool, the two configurations differ only in the mask flag and output locations. Between the tools, several differences remain by design (study README; registration): training data, network architecture, ensemble size (5 against 12), the score definition and padding. SpliceAI pads positions outside the transcript with N (unknown base); Pangolin does not. Masking also works differently. SpliceAI masks only when an extreme score falls on the single nearest annotated boundary, while Pangolin masks every annotated position in the window before picking extremes. As the study README puts it, "equal mask flags are not equal operations."
Figure 3. What the design holds constant and what it does not. The within-tool arrows isolate the mask flag; the cross-tool comparison concerns configured tools and does not isolate architecture. Sources: study README; registration.
Why Pangolin needed a patch
Upstream Pangolin masks its per-strand score arrays in place. When a variant overlaps two same-strand genes, masking for the first gene leaks into the next, so a gene's masked score depends on processing order (Pangolin issue #29, open when checked on 28 September 2026). In this test set, 344 variants have at least two same-strand genes. The study's patch gives each gene its own copy of the arrays, equivalent to PR #30, which its author closed without merging on 16 July 2025. With masking off, patched output was byte-identical to upstream in tests and on 60 synthetic non-MFASS variants. Stock Pangolin with its default masking may therefore give different masked scores for variants in overlapping same-strand genes.
Reading the metrics
Precision at 100 (P@100) is the share of a tool's 100 highest-scoring variants that the assay confirmed; 63 of 100 is 0.63. The 100 is the benchmark's planning figure, not a measured lab capacity. It moves in steps of one variant and ignores the rest of the list.
Average precision (AP) summarises precision as progressively lower score thresholds retrieve more positives, weighting each precision by the increase in recall (scikit-learn's definition). With distinct scores and only two positives, ranking them first and second scores 1.0; ranking them first and fourth scores (1 + 0.5) / 2 = 0.75. Tied scores enter together at one threshold. A random ranking scores about the share of positives, here 0.038.
AUROC measures how often a randomly chosen disruptive variant outranks a randomly chosen neutral one, with half credit for ties; random ordering gives 0.5. When positives are rare, AUROC can stay high while the top of the list is mediocre, and it can miss differences in early retrieval that AP and P@100 pick up.
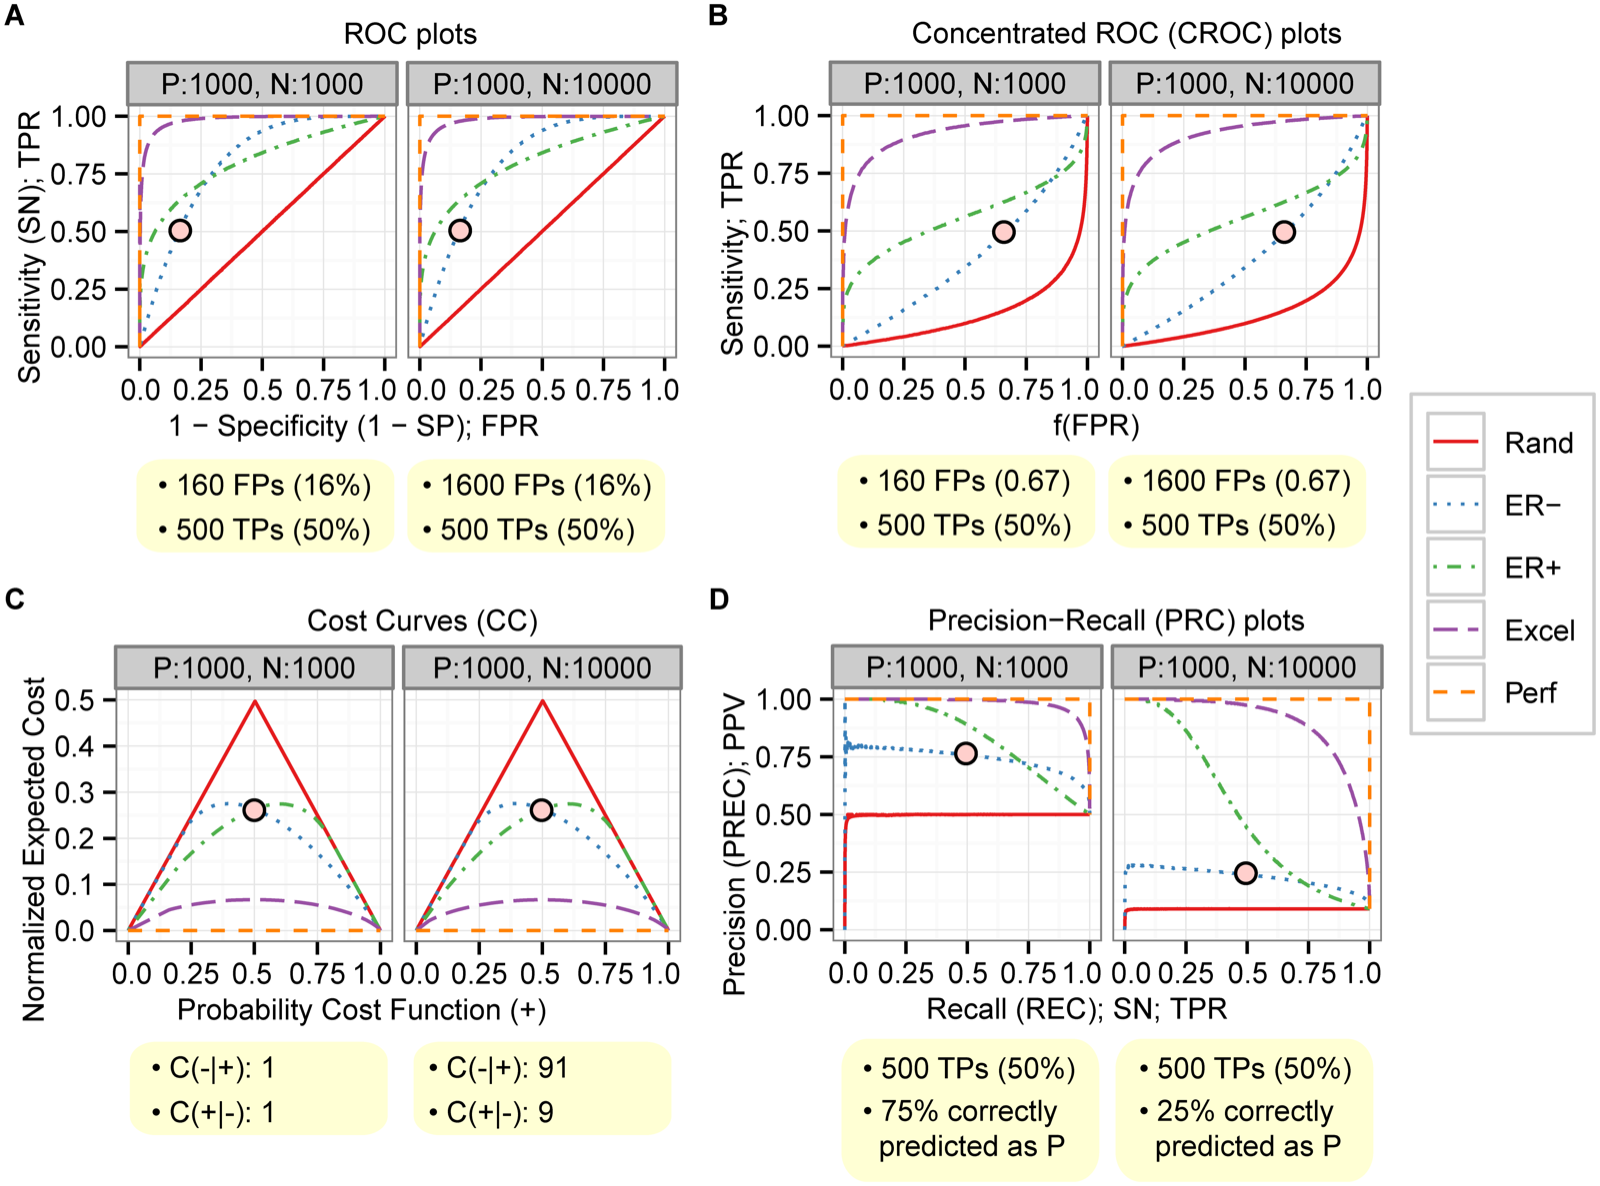
Figure 4. With ten times more negatives, the ROC curves (A) do not change, while the precision-recall curves and their random baseline (D) drop. MFASS is more imbalanced still, at about 1 positive in 26. The panels are simulations. Source: Saito & Rehmsmeier, PLoS ONE 2015, Fig. 5, CC BY 4.0.
Intervals come from a grouped bootstrap. Variants in one exon share context, so the procedure draws the 460 scored groups with replacement, 2,000 times, recomputes each paired difference, and reports the middle 95% (study README). The P@100 cutoff scales with each resampled list's length. An interval excluding zero supports a difference under this resampling procedure; one including zero does not establish a difference. The point is the observed difference.
Results on the shared 8,297 variants
| Condition | P@100 | AP | AUROC | Ties at the 100th score |
|---|---|---|---|---|
| S0: SpliceAI, mask off | 0.63 | 0.295 | 0.804 | 1 tied for 1 slot |
| S1: SpliceAI, mask on | 0.65 | 0.313 | 0.815 | 2 tied for 2 slots |
| P0: Pangolin, mask off | 0.65 | 0.389 | 0.876 | 1 tied for 1 slot |
| P1: Pangolin, mask on | 0.66 | 0.411 | 0.873 | 3 tied for 2 slots |
Table 2. Point metrics on the 8,297 variants scored in every condition (314 positives, 460 groups); coverage is 8,297 of 8,324 for each condition. The ties column counts variants sharing the score at the 100th rank and the top-100 slots they compete for. Four-decimal values are in the linked files. Sources: study README; report.json.
Masking changed the score of 1,562 variants for SpliceAI and 2,042 for Pangolin, and the two unmasked tools gave different scores to 4,943 of the 8,297.
| Contrast | P@100 | AP | AUROC |
|---|---|---|---|
| S1 − S0 (SpliceAI masking) | +0.020 [0.000, 0.062] | +0.017 [0.006, 0.028] | +0.011 [−0.007, 0.027] |
| P1 − P0 (Pangolin masking) | +0.010 [0.000, 0.040] | +0.022 [0.011, 0.034] | −0.004 [−0.019, 0.013] |
| P0 − S0 (unmasked tools) | +0.020 [−0.033, 0.083] | +0.093 [0.064, 0.124] | +0.073 [0.048, 0.096] |
Table 3. Paired differences, candidate minus baseline, on 8,297 common variants, 314 positives and 460 groups, with 95% grouped-bootstrap intervals (2,000 draws, seed 20260914, no single-class draws). Nine intervals with no multiplicity adjustment. Sources: S1 − S0, P1 − P0 and P0 − S0 contrast files.
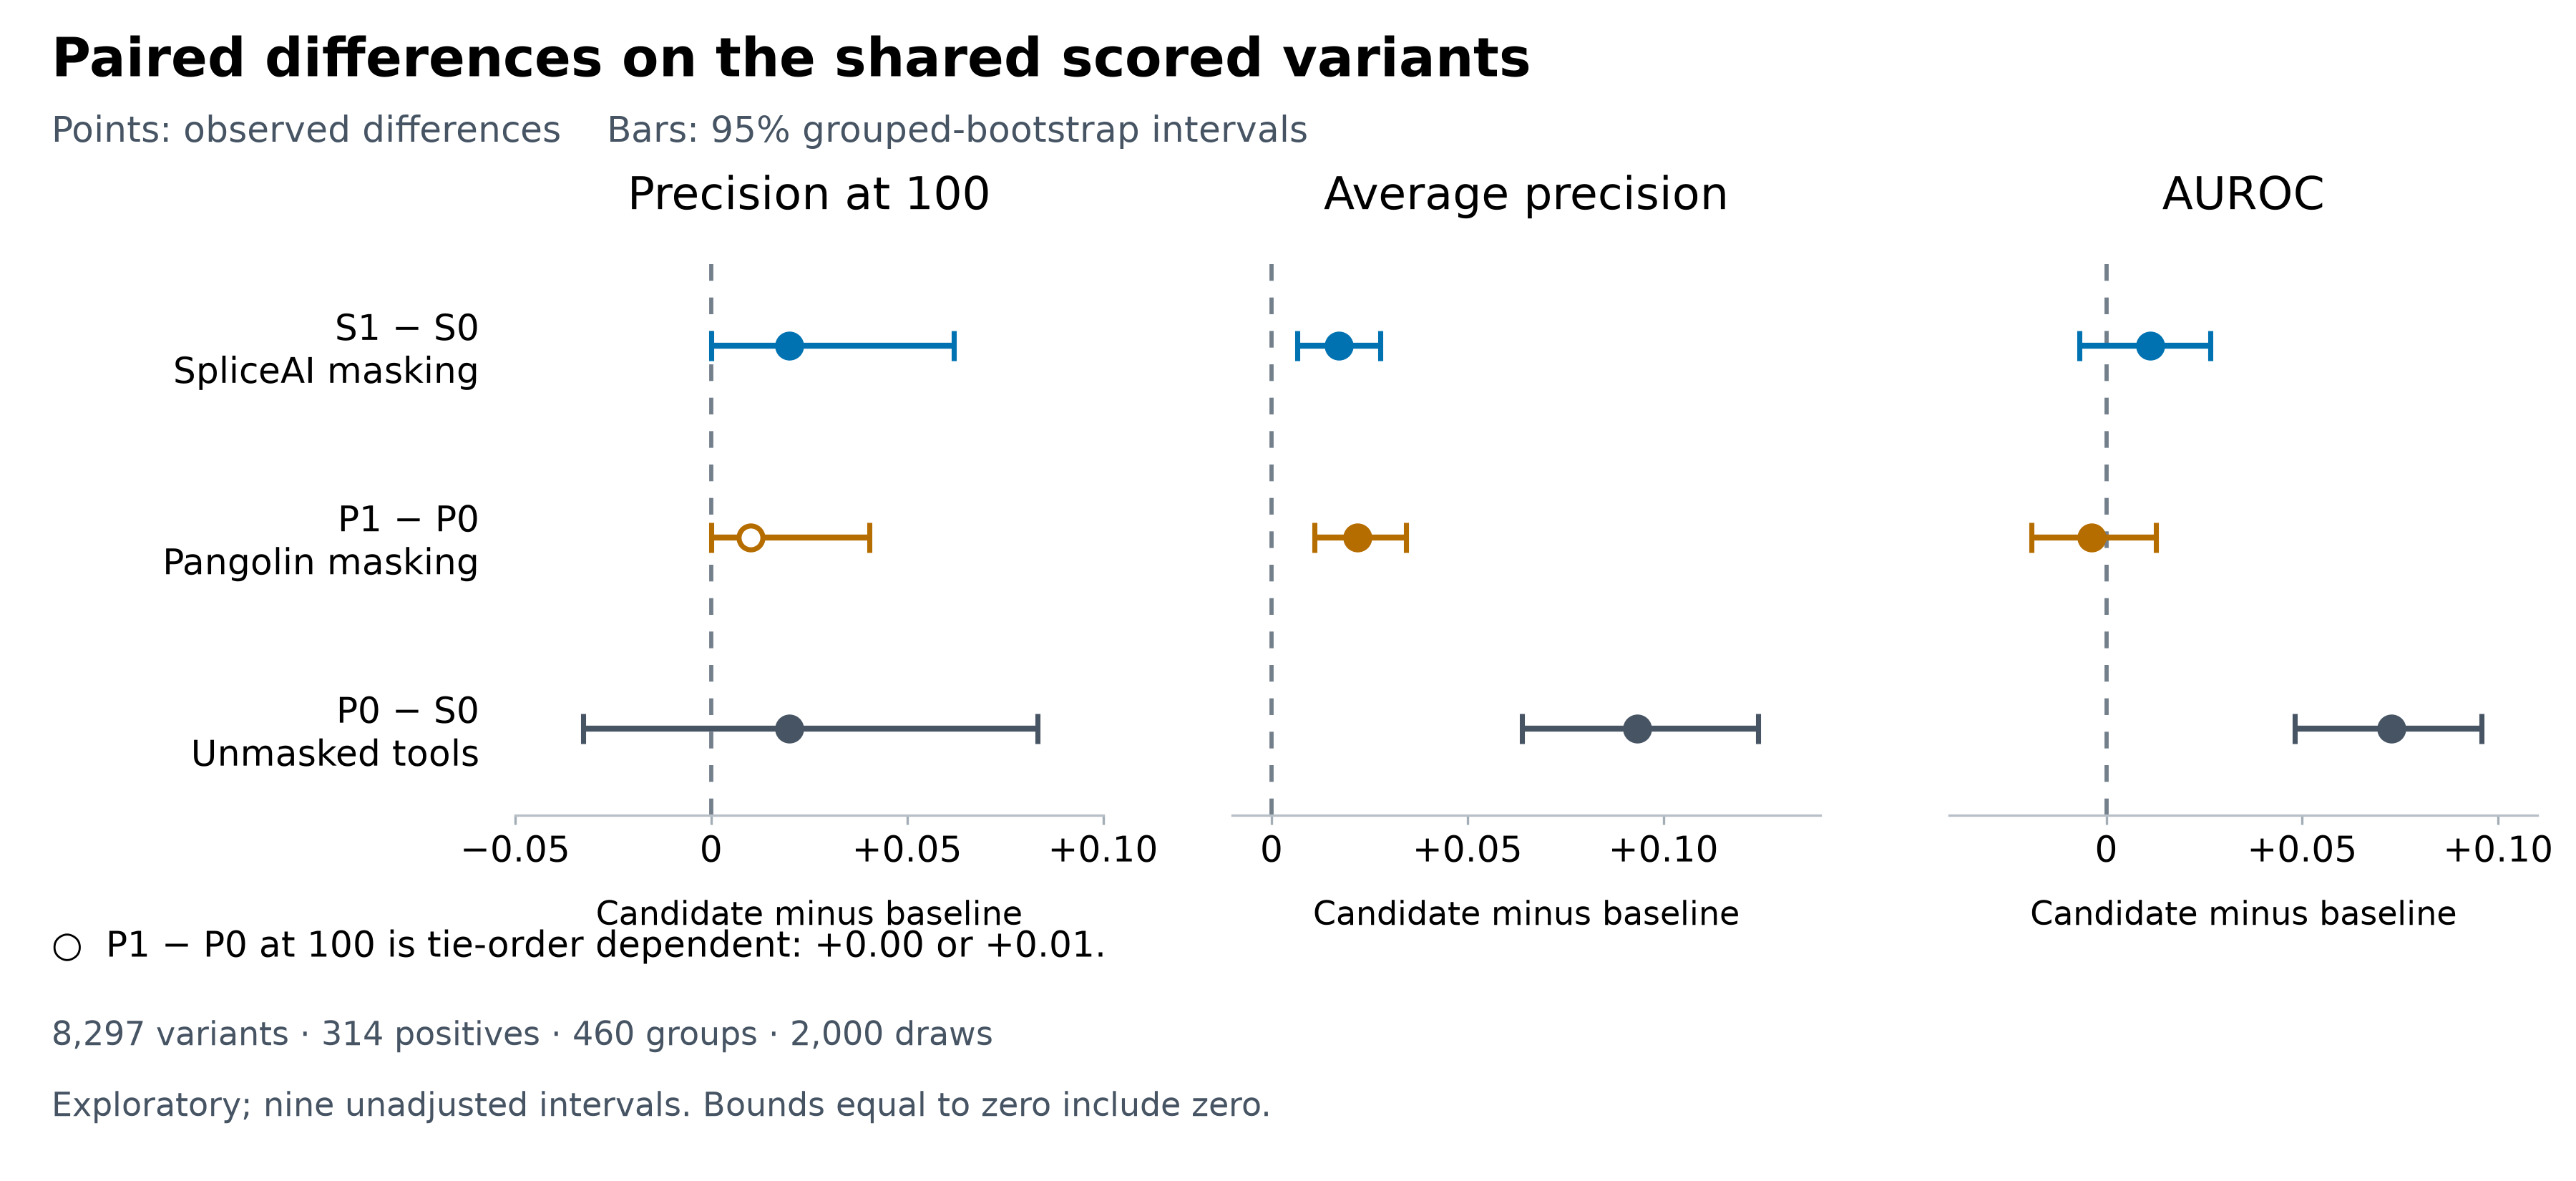
Figure 5. The nine paired differences from Table 3. Bars that reach or cross the dashed line include zero. For masking, only AP moves clear of zero; for the unmasked tools, AP and AUROC do and P@100 does not. The intervals are exploratory and unadjusted. Sources: S1 − S0, P1 − P0 and P0 − S0.
Masking within each tool
AP rose for both tools and both intervals sit above zero. The gains are small: about 0.02 on a scale where the four conditions range from about 0.30 to 0.41. The AUROC intervals include zero, and so do the P@100 intervals, so masking did not establish a change in either.
Unmasked tools under one annotation
With masking off on both sides, Pangolin's AP was 0.093 higher (0.064 to 0.124) and its AUROC 0.073 higher (0.048 to 0.096). In the top 100 it found two more positives, but that interval runs from 3.3 fewer to 8.3 more per 100, so this test set cannot separate the two at that budget. The benchmark's improvement rule, a P@100 gain of at least 0.05 with a lower bound above zero, is written for future prospectively registered, unseen cohorts, so here it is neither met nor failed.
For context only, the earlier unmatched run reported AP +0.092 and AUROC +0.070 for Pangolin minus SpliceAI on a different subset of 8,194. Different populations and annotations, and incomplete pinning of the earlier run, prevent attributing this similarity to annotation.
Two quirks of precision at 100
Why two lower bounds are zero. P@100 changes one variant at a time, and many resampled datasets give a difference of exactly zero (automated review). For S1 − S0, 0.5% of draws were below zero, 22.5% exactly zero and 76.9% above. For P1 − P0 the shares were 0.0%, 44.4% and 55.6%. The 2.5th percentile lands on zero, so an interval such as [0, 0.062] includes zero and does not show a positive effect.
Ties. Both tools print scores to two decimals, which creates ties. In P1, three variants share the score 0.54 for the last two top-100 slots, and one of them is positive. Ordering the tied variants without using labels gives P1 either 0.65 or 0.66, so P1 − P0 is +0.00 or +0.01; the reported +0.010 comes from the registered fixed tie-break. The other two P@100 differences do not depend on tie order.
Accounting for the 27 unscored variants
Both tools refused the same 27 variants, exactly those predicted by a label-free check before scoring (registration). They were not scored as zero or counted as negatives, and coverage is always reported against 8,324 (exclusion addendum).
| Step | Variants | Remaining |
|---|---|---|
| Held-out MFASS variants | 8,324 | 8,324 |
| Recorded reference base differs from GRCh38 (orientation lost in hg19 to hg38 conversion) | −23 | 8,301 |
| No gene under any selected canonical transcript span (ARHGEF3) | −4 | 8,297 |
| Scored in all four conditions | 8,297 |
Table 4. The exclusions as a partition: 8,324 = 8,297 + 23 + 4. The scored set keeps 314 of 315 positives, so one positive is among the 27, and 460 of 463 groups, so three groups have no scored variant. Sources: exclusion addendum; coverage verification.
Twenty-three alleles left in hg19 orientation
MFASS used hg19 (GRCh37); this study uses hg38 (GRCh38). UCSC's liftOver tool converts coordinates using a chain file describing alignments between the assemblies. For some regions the chain places the sequence on the opposite strand of the other assembly. DNA is double-stranded, and a base read from the other strand is its complement: A becomes T, and G becomes C.
The MFASS authors converted their coordinates with a four-column BED file (chromosome, start, end and name, with no strand column) and then joined the new coordinates back to records that kept their hg19 alleles. Reading UCSC's liftOver source code suggests why the inversion went unnoticed: the program takes a feature's strand only from a sixth BED column and writes the mapped strand back only when that column exists. That is an inference from the code rather than a statement in UCSC's documentation, which separately advises against using liftOver for SNPs.
For example, an hg19 A-to-G variant in a reversed region becomes T-to-C in hg38. Keeping A-to-G makes a predictor find T where the record claims A and refuse to score it. Figure 6 uses invented bases to illustrate this.
Figure 6. The inferred mechanism for the 23 reference mismatches, drawn with made-up bases. The liftOver behaviour shown is inferred from UCSC's source code. Complementing is safe only where the mapping orientation and sequence context have been validated. Sources: exclusion addendum; UCSC chain format; liftOver.c.
According to the addendum, each affected record maps uniquely and exactly in the original chain, its full assay reference window matches GRCh38 once orientation is applied, and complementing both alleles reproduces the assayed change. The addendum attributes the mismatches to assembly conversion; the MFASS authors have not confirmed the diagnosis. Twenty-one of the 23 are in exon ENSE00001321140 and two in ENSE00001002968.
Four variants outside the canonical transcript
Four ARHGEF3 variants (ENSE00002361772_001, _004, _005 and _008) match the reference but fall outside the selected canonical and MANE Select transcript, ENST00000296315.8, which spans chr3:56,727,420–56,801,949. Ten other transcripts cover each position (addendum). Under the one-transcript-per-gene protocol these are scope exclusions; nothing is known to be wrong with the records. Scoring them would need a different, all-transcript protocol, since stretching the gene span while keeping only canonical exon boundaries would not be consistent.
The whole-cohort check and the decision
A check of all 27,733 eligible MFASS records found 90 with an inverted mapping and unconverted alleles: the 23 test exclusions and 67 training records. None of the 8,297 scored test records has this defect; all passed the reference-window and allele checks. A further 37 training records have other reference-build context differences. Neither the 67 nor the 37 affect this comparison, because neither tool is fitted to MFASS labels, though anyone training a model on MFASS genomic coordinates would meet them.
All 27 exclusions were retained with explicit coverage. Frozen results and alleles stayed unchanged; no inference was rerun. The 23 deserve the most caution. They cluster in two exons, so dropping them is not like dropping a random 23, and no scores exist for them, so their effect on the metrics has not been measured. That would need a separately versioned evaluation with fresh verification.
The conversion issue was reported upstream by this article's author as KosuriLab/MFASS issue #1. When checked on 25 and 28 September 2026 it was open with no reply from the MFASS authors, so the diagnosis has no author confirmation.
How the study was run and checked
The 24 September 2026 registration was bound by hash to the frozen manifest, with notice on issue #19 before scoring. A frozen plan does not make this confirmatory: the MFASS test outcomes had already been inspected in earlier work, so the study is labelled exploratory.
The four conditions ran as one sequential job on an Apple M4 CPU, 50,949 seconds (about 14 hours) from start to finish, with no retries or resumes. Scoring took about 6,100 to 6,900 seconds per SpliceAI condition and 18,700 to 19,200 per Pangolin condition (S0 result file, with matching fields in the others).
An automated Claude scientific review recomputed every hash, row, metric and bootstrap interval from the raw files, found exact agreement, and raised four non-blocking points about wording and reproducibility. The exclusion investigation and a fresh coverage verification were later computational checks by Codex, a different automated agent. None of these is a human review, and none independently reproduced the model inference.
What this comparison does not show
- It does not name a better tool or setting for a 100-variant queue. The P@100 interval for P0 − S0 runs from −0.033 to 0.083.
- It does not measure architecture. P0 − S0 bundles training data, architecture, ensemble size, score definition, padding and masking rules.
- It says nothing about other models or datasets, other annotation choices, patient RNA or clinical use.
- It does not describe performance on the 27 unscored variants or on the full 8,324.
- With nine unadjusted intervals on outcomes seen before, any single interval that excludes zero could still be a chance finding.
What practitioners can take from this
- Record the annotation and the mask setting with every splice score. Here the mask flag alone changed 1,562 SpliceAI scores and 2,042 Pangolin scores.
- Running both tools at their defaults means SpliceAI unmasked against Pangolin masked, which differs from every pair tested here.
- Before comparing tools, match the annotation and the scored population, report coverage against the original denominator, and never count an unscored variant as a negative.
- Treat a refusal to score as information about the input. Here it led to a conversion issue that also touches 67 training records.
Data and the next test
The study bundle at rewire-benchmarks revision 093fd1a holds the predictions, contrast files, manifest and review; rerunning the comparison on the published predictions reproduced all three contrast reports. Cohort alleles are withheld because the MFASS source tables state no reuse terms. The exclusion addendum at 4be7a98, merged in PR #23, lists the 27 variants and their causes. The benchmark database page lists the four configurations (labelling Pangolin as version 1.0.2) and showed 8,297 of 8,324 coverage when verified on 25 September 2026 and rechecked on 28 September.
The next test is a separately versioned evaluation that scores the 23 orientation records with validated conversion and reports whether any of the nine contrasts move. Separating the tools at a 100-variant budget needs an independent cohort registered before its outcomes are seen, with the queue size and the smallest useful difference fixed in advance.
Sources
- Chong et al., A multiplexed assay for exon recognition (MFASS), Molecular Cell 2019
- KosuriLab MFASS at revision
9a8e4f2: liftOver script, formatting and coordinate join, issue #1 - Jaganathan et al., SpliceAI, Cell 2019; SpliceAI README at
b3c7f17,utils.pyatb3c7f17and current README FAQ - Zeng & Li, Pangolin, Genome Biology 2022; Pangolin README at
5cf94b8, issue #29, PR #30 - Ensembl, Canonical transcript selection
- Morales et al., A joint NCBI and EMBL-EBI transcript set for clinical genomics (MANE), Nature 2022
- Smith & Kitzman, Benchmarking splice variant prediction algorithms using massively parallel splicing assays, Genome Biology 2023
- UCSC: chain format, FAQ on assembly releases and liftOver, kent liftOver.c
- scikit-learn, average_precision_score
- Saito & Rehmsmeier, The precision-recall plot is more informative than the ROC plot when evaluating binary classifiers on imbalanced datasets, PLoS ONE 2015
- rewire-benchmarks at
093fd1a: study bundle, study README, report.json, contrast files S1 − S0, P1 − P0 and P0 − S0, automated scientific review, registration, MFASS benchmark README - rewire-benchmarks at
4be7a98: exclusion addendum, coverage verification, specialist comparison protocol; PR #23; issue #19 - rewire benchmark database: MFASS matched-annotation protocol
- rewire.it, MFASS: What three splice-variant rankers put in the first 100
Help improve this article
Found an error or a better source? Leave a note here, or highlight a passage to comment on it.